Methodology; Current Standings; Florida, Maryland, New Mexico, Tennessee, Vermont
I made a slight methodological change today: Instead of using the end date of each poll, I'm using the middle date. Recently, there have been some polls published with long time frames, including a bizarre Alabama poll with the dates "5/4-6,5/17-20." I also slightly updated (more like corrected) the formula I use for estimating sample size from published margin of errors. In practice, neither of these changes does much, since most polls publish sample size and have short time frames.
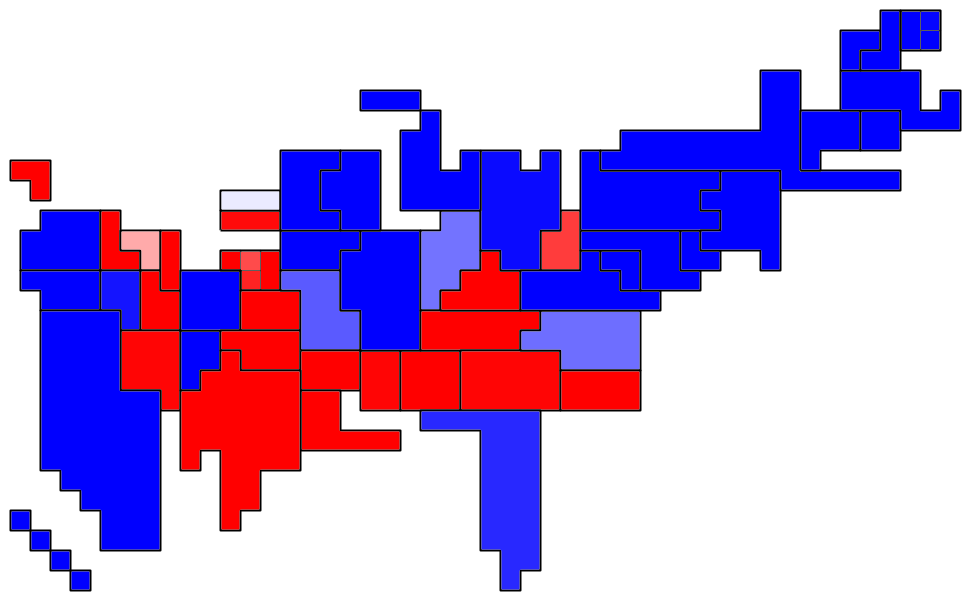
Kerry has an 87.6% chance of winning and an expected 295.3 electoral votes. Kerry could win without any of his tossup states, while Bush would need at least 36 electoral votes from Kerry's side. Bush has 50.27% of the Bush/Kerry popular vote.
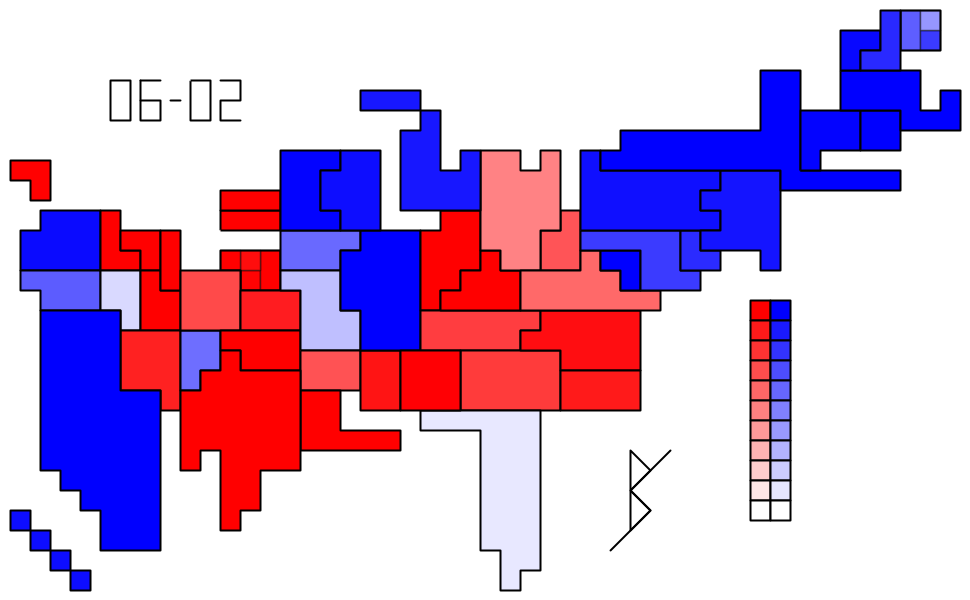
Cartogram showing, for each electoral vote, the chances that the leading candidate will win:
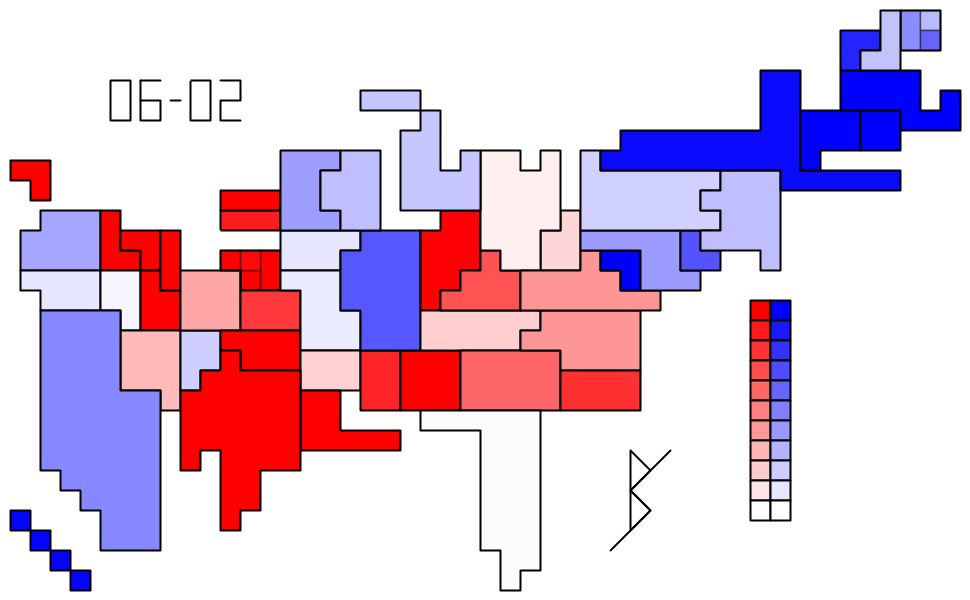
Cartogram showing, for each electoral vote, the leading candidate's lead.
Florida (27) changed from Tossup Kerry to Close Tossup Kerry; Maryland (10) changed from Very Safe Kerry to Safe Kerry; New Mexico (5) changed from Safe Kerry to Very Probable Kerry because of aging data; Tennessee (11) changed from Very Safe Bush to Safe Bush; Vermont (3) changed from Extremely Safe Kerry to Very Safe Kerry. These happened because of methodological changes, except as noted.
posted by Benjamin Schak at 12:56 PM
![]()

0 Comments:
Post a Comment
<< Home