03/01/08: Obama by 3%
Popular vote estimate:
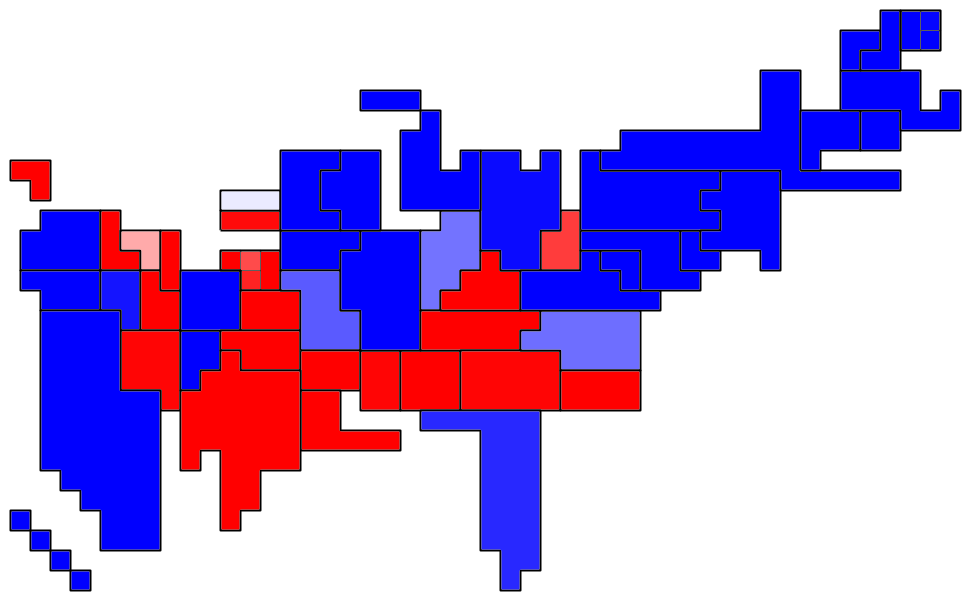
(Darker red means more votes for McCain, darker green for Obama.)
Prediction if the election were today
- Probability of electoral victory: over 99%.
- Expected value of electoral votes: 318.
- 95% range of electoral votes: 285 to 347.
- Probability of electoral college tie: under 1%.
- Probability of popular victory: over 99%.
- Expected popular vote: Win by 2.8%.
- Swing states:
- PA 49%.
- OH 38%.
- Electoral vote distribution (electoral votes vs. probability):

- Confidence map (states sized by electoral vote, darker red means higher confidence that McCain will win, darker green for Obama):

Prediction for Election Day
- Probability of electoral victory: 78%.
- Expected value of electoral votes: 308.
- 95% range of electoral votes: 187 to 400.
- Probability of electoral college tie: under 1%.
- Probability of popular victory: 75%.
- Expected popular vote: Win by 2.8%.
- Swing states:
- PA 84%.
- OH 84%.
- MO 71%.
- NH 65%.
- NJ 59%.
- CO 59%.
- WI 58%.
- NV 53%.
- NM 49%.
- AR 49%.
- FL 47%.
- ME2 45%.
- MI 35%.
- CT 35%.
- OR 34%.
- Electoral vote distribution (electoral votes vs. probability):

- Confidence map (states sized by electoral vote, darker red means higher confidence that McCain will win, darker green for Obama):

posted by Benjamin Schak at 5:26 PM
![]()

0 Comments:
Post a Comment
<< Home