McCain by 1.3%
Commentary
I think my view from two weeks ago has been borne out by more recent polls; the bleed stopped, but there's been essentially no rebound.
I expected that the contentious Obama-Clinton primary would have hurt Obama more in PA this past month than elsewhere, as bitter Clinton supporters refuse to tell pollsters that they'll support Obama in the general election. This, however, appears not to be the case. In fact, after many months of Pennsylvania becoming more Republican relative to the whole US, the difference between PA and the US seems to have been constant for the past month. It could be that any losses due to disgruntled Clinton supports are outweighed by gains due to Pennsylvanians getting to know Obama as he campaigns there.
Here's the relevant chart. The x-axis is time, measured in days. The y-axis is tenths of a percent. The red line is my estimate of the difference between the Obama-McCain margin in PA and the Obama-McCain margin in the US; higher numbers mean that PA favors Obama more than the US.

Popular vote estimate:
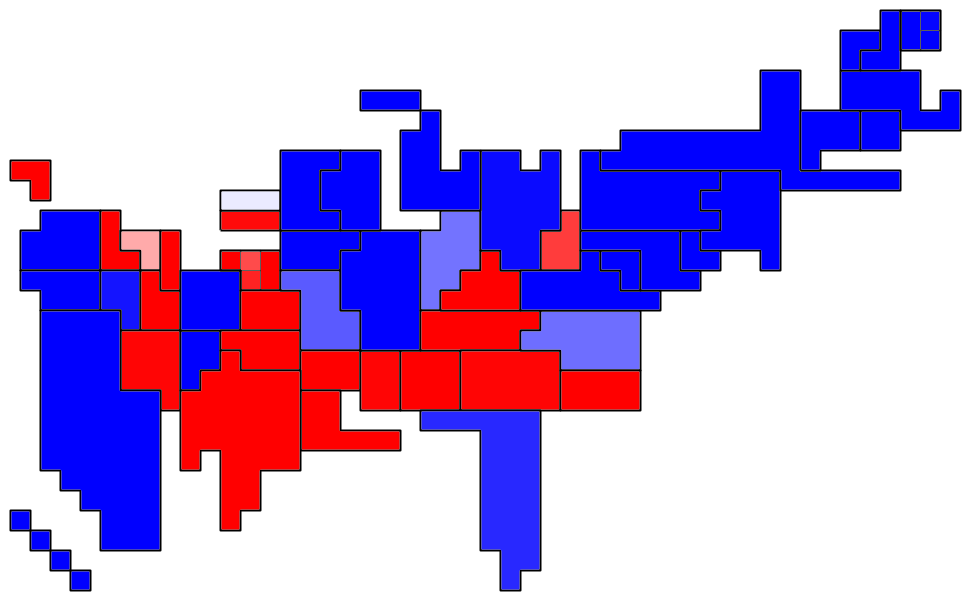
(Darker red means more votes for McCain, darker green for Obama.)
Prediction if the election were today
- Probability of electoral victory: 8%.
- Expected value of electoral votes: 249.
- 95% range of electoral votes: 216 to 278.
- Probability of electoral college tie: under 1%.
- Probability of popular victory: 8%.
- Expected popular vote: Loss by 1.3%.
- Swing states:
- PA 89%.
- OH 51%.
- Electoral vote distribution (electoral votes vs. probability):

- Confidence map (states sized by electoral vote, darker red means higher confidence that McCain will win, darker green for Obama):

Prediction for Election Day
- Probability of electoral victory: 32%.
- Expected value of electoral votes: 248.
- 95% range of electoral votes: 164 to 336.
- Probability of electoral college tie: under 1%.
- Probability of popular victory: 36%.
- Expected popular vote: Loss by 1.3%.
- Swing states:
- PA 93%.
- OH 82%.
- NH 67%.
- NJ 57%.
- MO 55%.
- MI 45%.
- WI 42%.
- NV 39%.
- CO 36%.
- FL 36%.
- NM 34%.
- CT 34%.
- Electoral vote distribution (electoral votes vs. probability):

- Confidence map (states sized by electoral vote, darker red means higher confidence that McCain will win, darker green for Obama):

posted by Benjamin Schak at 10:01 PM
![]()

0 Comments:
Post a Comment
<< Home