Measures of Swinginess
There are many reasonable ways to measure how much of a swing state a state is. I want to describe the two methods that I use on this site, as well as the method that FiveThirtyEight.com uses, and what I think the pluses and minuses of each are.
Swinginess Method 1: Correlation to electoral college results. Whether Obama wins a state is a random variable, whether Obama wins the electoral college is another random variable, and these two random variables have some correlation. Definitionally, states that are better indicators of the national results will have a higher correlation.
Advantages of Method 1 (correlation). This measure is easy to calculate, and may be useful on Election Night to know which states' results to focus on during the early part of the evening.
Disadvantage of Method 1 (correlation). This method fails to make it clear how much more important a large state is than a small state. For example, suppose that simulations in advance of the 2000 election showed 1) that Bush would clearly win all the states he ultimately won, except FL, for 246 electoral votes; 2) that Gore would clearly win all the states he ultimately won, except NM, for 261 electoral votes; and 3) that NM and FL would both have 50/50 chances to go either way. In this scenario, the only state that matters is FL with its 25 electoral votes; NM's 5 votes wouldn't matter at all. Under the correlation measure, the FL results would have 100% correlation with the electoral results, but the NM results would also have very high (probably 90%+) correlation with the electoral results because opinion changes in the two states are highly correlated. This measure of swinginess would clearly be ludicrous in this situation, since FL is the only state that matters.
The Banzhaf Index. The Banzhaf Index attempts to measure the power of a voting bloc in an election. In the context of the electoral college, it is defined as the probability of a state's results changing the outcome of the election, assuming that each candidate has a 50% probability of winning each state, and that state results are uncorrelated. See the Wikipedia page cited above for more details.
The Shapley-Shubik Index. The Shapley-Shubik Index also attempts to measure the power of a voting bloc in an election. It gives equal weight to all possible sequences in which states may join a winning coalition, and measures how often a given state is the one that put the coalition over the edge. See the Wikipedia page cited above for more details.
Disadvantage of using a power index. The obvious disadvantage of these two indices is that they don't take into account that states aren't equally likely to vote either way, and that all the possible winning combinations are unequally likely to happen. They end up indicating that the largest states -- CA, TX, and NY -- are the most important, even though we all know that they are all safe states. These power indices are useful for some purposes, but not for discovering what the swing states are.
Swinginess Method 2a (naive pseudo-Banzhaf). Like the Banzhaf Index, this measures a probability that a state's results will matter the outcome of the election, but without the Banzhaf Index's inapt assumptions about the state results. Instead, run the election simulations, and give each state 1 point each time it is in the winning coalition and necessary to the coalition; 0 points each time it is in the losing coalition; and 0 points each time it is in the winning coalition but unnecessary to the coalition. Then after running 10,000 simulations or so, I divide each state's number of point by the number of simulations.
Disadvantage of Method 2a. This gives too much weight to large states that one candidate will clearly win. For example, CA gets full credit as a "swing state" whenever Obama wins a simulation by under 110 votes. Clearly this is wrong since Obama will win CA in any close national election. A better method will take into account that Obama is ahead by a lot in CA, but only by a little bit in PA.
Swinginess Method 2b (pseudo-Banzhaf). The solution to the problem with Method 2a is to give a state more credit for swinginess when its results are very close in a simulation -- intuitively, FL should get more credit than TX for swinginess in the 2000 election even though the loss of either state would have swung the electoral college for Bush, since FL had a very close election and TX did not. In this sort of situation, FL should get very close to 1 point, and TX should get very close to 0 points. The formula I use to assign points to relevant states is 2*NormalCDF((0.5-SimulVote)/EstVol) for a state in the winning coalition with enough electoral votes to be necessary to the coalition, 0 for a state in the winning coalition that is unnecessary to the coalition, and 0 for a state in the losing coalition. Here NormalCDF is the cumulative distribution function of the standard normal distribution, SimulVote is the state's result in the simulation, and EstVol is 1 standard deviation of uncertainty in my forecast for that state.
Swinginess Method 3 (pseudo-Shapley-Shubik). This is the solution that fivethirtyeight.com uses, and you can read a description at that website. (I would calculate it from my simulations too, but my poor coding makes this a hard thing to implement.) The key difference between this method and the Shapley-Shubik Index is that Shapley-Shubik orders the states randomly, while Method 3 orders them from the most pro-McCain state to the most pro-Obama.
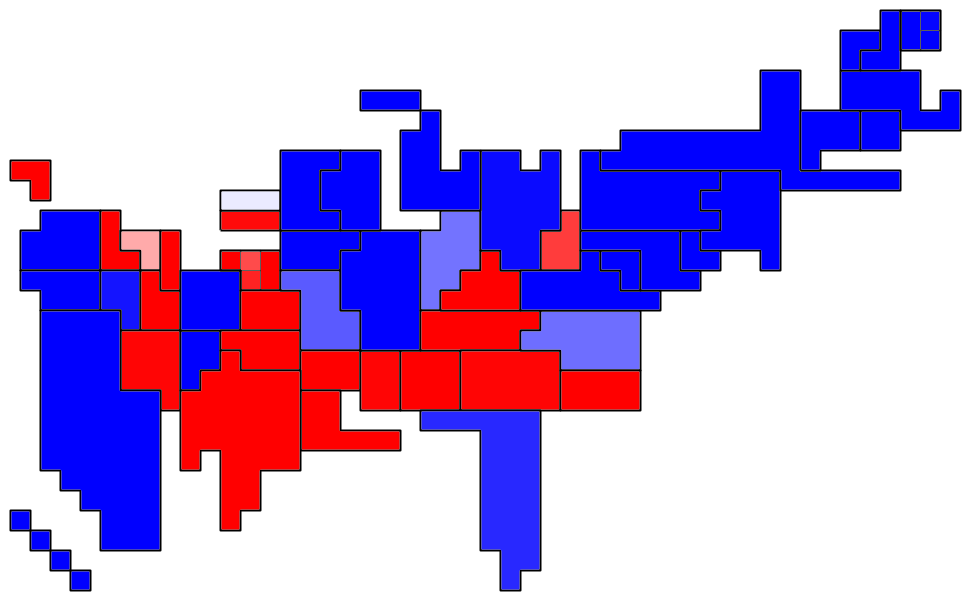
The critical question: What is a "swing state"? Before continuing to read this, go look at the results of the 1984 election, and decide what states you think should count as "swing states." Thinks this through, and then scroll down to see what I think the two reasonable answers are.
One possible answer is, "There are no 'swing states' because no individual state is so important in such a blowout." Another possible answer is, "States like MI, MO, and GA were 'swing states'; because if the nation as a whole had moved uniformly towards Mondale so that the election became close to even, then those states would have been the ones to make a difference." There's no clear "right answer" here. I think I prefer the first for analyzing a particular election, but the second for analyzing the general political milieu. That is, if I were concerned with the 1984 election specifically, then I think the right answer is that there were no swing states; but if I were concerned with which states occupied the political center in the mid-80s, then I think the right answer is that MI, MO, GA, etc. did.
The critical advantage/disadvantage of Methods 2b and 3, depending on your perspective. The pseudo-Banzhaf index uses the first interpretation of what a swing state is, and the pseudo-Shapley index uses the second interpretation. If you measured these on simulations just before the 1984 election, you would find that each state had a pseudo-Banzhaf index of ≈0, but that MI, MO, GA, etc. had significant pseudo-Shapley index scores.
I hope that explanation was clear enough. If it's not, ask questions in the comments and I'll try to do better.


0 Comments:
Post a Comment
<< Home