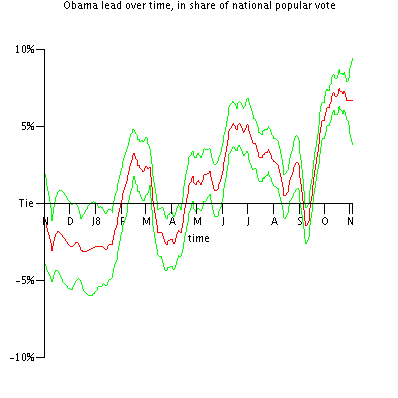
Obama by 0.9%
Popular vote estimate:
(Darker red means more votes for McCain, darker green for Obama.)
Prediction if the election were today
- Probability of electoral victory: 85%.
- Expected value of electoral votes: 283.
- 95% range of electoral votes: 248 to 309.
- Probability of electoral college tie: 3%.
- Probability of popular victory: 84%.
- Expected popular vote: Win by 0.9%.
- Swing states:
- PA 88%.
- OH 40%.
- Electoral vote distribution (electoral votes vs. probability):

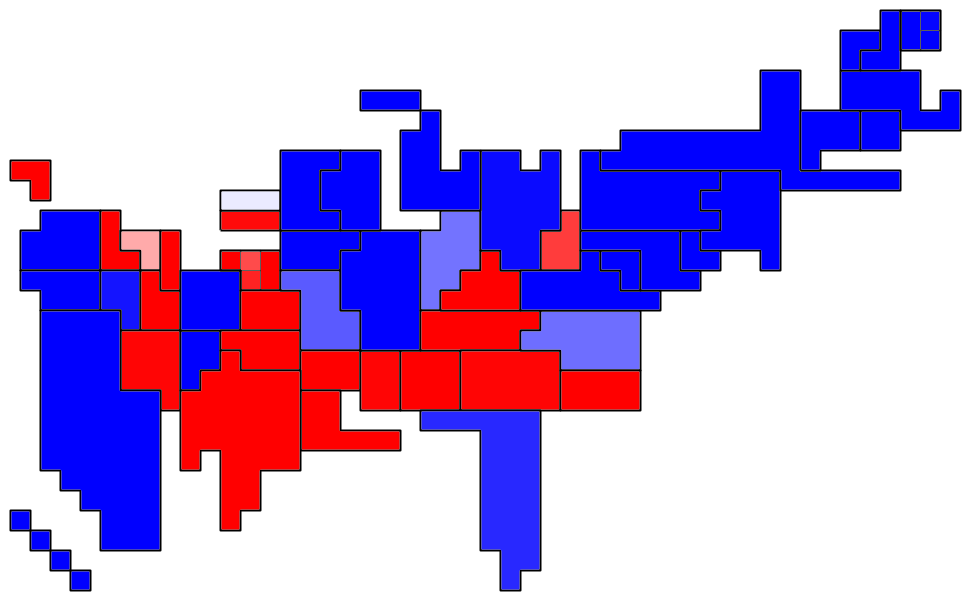
- Confidence map (states sized by electoral vote, darker red means higher confidence that McCain will win, darker green for Obama):

Prediction for Election Day
- Probability of electoral victory: 63%.
- Expected value of electoral votes: 278.
- 95% range of electoral votes: 185 to 355.
- Probability of electoral college tie: 2%.
- Probability of popular victory: 62%.
- Expected popular vote: Win by 0.9%.
- Swing states:
- PA 92%.
- OH 74%.
- NH 66%.
- CO 56%.
- NV 56%.
- MI 54%.
- NM 50%.
- MO 49%.
- NJ 46%.
- WI 43%.
- Electoral vote distribution (electoral votes vs. probability):

- Confidence map (states sized by electoral vote, darker red means higher confidence that McCain will win, darker green for Obama):

posted by Benjamin Schak at 10:17 AM
![]()

0 Comments:
Post a Comment
<< Home