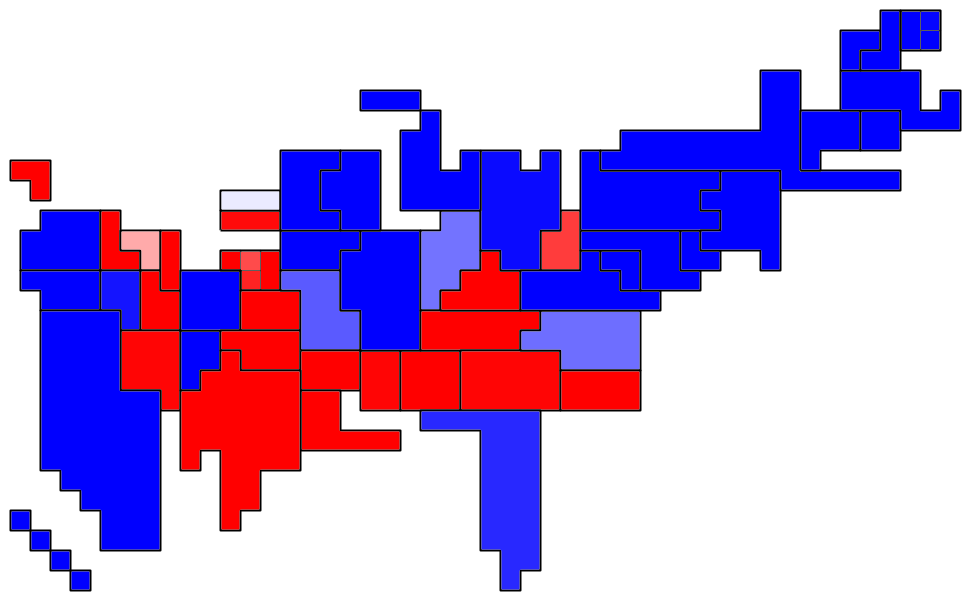
Website roundup
A lot of websites make lists that purport to predict the election. I thought I'd look at each of them and make some comments.
| Code | Me | 538 | CNN | MSNBC | NYT | Cook | Intrade | US Election Atlas | Average |
|---|---|---|---|---|---|---|---|---|---|
| AR | 1.9 | 0.6 | 30 | 10 | 10 | 35.7 | 19.5 | 30 | 17.2 |
| CA | 100 | 96.6 | 90 | 70 | 90 | 92.9 | 87.9 | 90 | 89.7 |
| CO | 92 | 66.2 | 50 | 50 | 50 | 50 | 66.75 | 50 | 59.4 |
| DE | 98.6 | 92 | 90 | 70 | 90 | 78.6 | 90.8 | 70 | 85.0 |
| FL | 28.6 | 20.8 | 50 | 50 | 50 | 35.7 | 29 | 30 | 36.8 |
| GA | 2.5 | 5.4 | 30 | 30 | 10 | 7.1 | 17.45 | 10 | 14.1 |
| IA | 99.2 | 83.9 | 50 | 50 | 50 | 50 | 77 | 50 | 63.8 |
| IN | 1.7 | 29.7 | 30 | 10 | 10 | 7.1 | 23 | 10 | 15.2 |
| LA | 7.1 | 5.2 | 30 | 30 | 10 | 7.1 | 13 | 10 | 14.1 |
| ME | 99.5 | 91.3 | 70 | 70 | 90 | 78.6 | 86.5 | 70 | 82.0 |
| ME1 | 99.9 | " | " | " | " | " | " | 90 | 84.5 |
| ME2 | 97.4 | " | " | " | " | " | " | 70 | 81.7 |
| MI | 85.7 | 49.9 | 50 | 50 | 50 | 64.3 | 70 | 50 | 58.7 |
| MN | 99.2 | 92.7 | 50 | 50 | 50 | 50 | 79.1 | 70 | 67.625 |
| MO | 52.5 | 34.7 | 50 | 50 | 10 | 21.4 | 42.5 | 50 | 38.9 |
| MS | 0.8 | 2.7 | 10 | 30 | 10 | 7.1 | 13.75 | 10 | 10.5 |
| MT | 27.4 | 19 | 30 | 30 | 10 | 7.1 | 17.8 | 10 | 18.9 |
| NC | 17.8 | 22.4 | 30 | 30 | 10 | 7.1 | 25.45 | 10 | 19.1 |
| ND | 5.5 | 26 | 10 | 10 | 10 | 7.1 | 11 | 10 | 11.2 |
| NH | 78 | 45.2 | 50 | 50 | 50 | 64.3 | 52 | 50 | 54.9 |
| NJ | 94.6 | 86 | 70 | 70 | 90 | 92.9 | 86.5 | 70 | 82.5 |
| NM | 81.4 | 62.7 | 30 | 50 | 50 | 50 | 66 | 50 | 55.0 |
| NV | 73.6 | 49.9 | 50 | 50 | 50 | 50 | 49 | 50 | 52.8 |
| OH | 68.7 | 49.6 | 50 | 50 | 50 | 35.7 | 60.4 | 50 | 51.8 |
| OR | 99.2 | 91.9 | 70 | 50 | 50 | 64.3 | 86 | 70 | 72.7 |
| PA | 82.9 | 67.5 | 50 | 50 | 50 | 64.3 | 75.5 | 50 | 61.3 |
| VA | 41.4 | 35.8 | 50 | 50 | 50 | 35.7 | 49.5 | 50 | 45.3 |
| WA | 99.8 | 97.6 | 70 | 70 | 50 | 78.6 | 90 | 70 | 78.2 |
| WI | 93.8 | 76.4 | 50 | 50 | 50 | 64.3 | 81 | 50 | 64.4 |
| WV | 12.7 | 11.7 | 30 | 10 | 10 | 21.4 | 14.5 | 10 | 15.0 |
| EC | 306.7 | 278.1 | 273.8 | 258.6 | 257.8 | 266 | 291.1 | 259.4 | 273.9 |
Me
I am the most bullish on Obama of the bunch. While I don't profess to understand what most of the other folks are doing (except for 538, which I understand pretty well), I can hazard some guesses about why this is the case.
- My results are fundamentally based on where the evidence shows the race stands today, without much regard to 2000 and 2004 results. I believe that most major pundits and outlets are still stuck in the framework of the 2000/2004 elections. The best example of this is IA. Poll after poll shows that Obama is clearly ahead in IA, and yet CNN, MSNBC, NY Times, and Cook all have IA as a toss-up. Of course, I can imagine that a pundit like Cook might sniff at this and say that he looks at more than just polls. But what then are they looking at? Seriously, I can't think of a single "soft factor" that would indicate a competitive IA except that Bush happened to win IA in 2004.
- Pundits tend to think that popular opinion is volatile. No matter how long Obama leads by a substantial amount, no pundit is likely to say that Obama is highly likely to win, because they believe at heart that popular opinion is volatile. Also, the idea of a volatile election makes for exciting TV. CNN in particular very badly obfuscated that fact that Hillary Clinton was clearly losing the Democratic primary, and I expect them to do so in the general, even if one of the candidates is clearly winning. In contrast to the pundits, I don't see much evidence that popular opinion changes quickly once people are familiar with the candidates. I believe that a race that starts out 50/50 is unlikely to be won by much more than 5-6 points.
- Pundits tend to think that popular opinion is mean-reverting (and that the 2000 and 2004 results represent the mean). This explains why they believe that IA is a swing state but CT is not, even though polling has been similar in the two states, and the two states have the same number of electoral votes. The pundits believe that IA will tend to revert to the 50/50 results of 2000 and 2004, while CT will tend to revert to the double-digit Democratic wins of 2000 and 2004. I actually do believe that people might be slightly mean-reverting, but I don't think that the 2000/2004 elections give enough data to know what the mean is, so my model assumes neither mean-reversion nor mean-aversion.
- I react quickly to new information. There are new polls released almost every day, and I incorporate each poll into my understanding of where each state is. By contrast, people like Big Media and Cook don't update often (why would they, since they fundamentally base their predictions on 2004?). Also, by contrast, Poblano/538 bases each state's prediction only on that state's polls, so that he's still rather neutral on several key states (OH, PA, NM, NV, CO) that haven't been polled recently, even though Obama has gained a couple points across the nation in the past two weeks. Interestingly, the other site that quickly incorporates new information is InTrade, which is the one site almost as bullish on Obama as I am.
Poblano/538
As mentioned above, the most important difference between me and 538 is that I incorporate information from all polls into my opinion of each state, using some assumptions about the correlations between states in shifts of voter opinion. This means that I don't have to wait around for polling in a particular state (such as OH currently) in order to detect that OH has likely swung to Obama in the past couple weeks; instead, I can observe that the nation has swung overall to Obama, and can infer (with some amount of uncertainty) that OH has as well. Additionally, this means that I can't be fooled as much by an outlier poll in a lightly-polled state. (Poblano sort of gets around this risk by having a constantly weighted input from his regression analysis, but I'm not a big fan of using regression analyses to predict results.)
I currently disagree most strongly with Poblano in that I am more bullish in a number of close states (OH, PA, CO, et.) that haven't had individual-state polls since Clinton dropped out. I'm pretty sure I have better results in each of these cases, since I'm clearly capturing new information (the fact the Obama has improved by a couple points in the polls) that 538 is not.
I also disagree (I'm more bearish on Obama) on IN. Since Indiana is lightly polled, I think Poblano's simulations are getting fooled by a single result from April that showed Obama to be ahead.
CNN
Now we're getting into the poorly done Big Media lists, where I'll just point out the most egregious idiocies.
CNN thinks that AR is only Lean Rep. Evidently they haven't updated their map since Hillary was ahead. They also think that NM is Lean Rep, even though it is much more arguably Lean Dem. How FL and MO are Tossup while NM is Lean Rep is beyond me, since Obama clearly does much better in NM than in FL or MO. And this isn't even a case of extrapolating 2000/2004 forward, since NM was very close in both those years.
MSNBC
I'm going to give more benefit-of-the-doubt to MSNBC, since their categories are "Battlegrounds," "Wildcards," and "Likelies," which I've (maybe wrongly) chosen to translate into tossups, leaners, and safes. They list some states in Wildcards (CA and MS) that should be pretty safe, but that McCain and Obama supporters badly want to find compelling. I suppose that Wildcard might mean "One of the candidates might be daft enough to waste substantial resources in trying to put this state in play, which would make this state interesting to watch," in which case I'd agree that CA and MS are wildcards.
NY Times
This is the best of the simplistic Big Media maps. There aren't any obvious errors, i.e., all the blue states are more pro-Obama than all the tossup states, and all the red states are more pro-McCain than all the tossup states. I'd suggest that blue states like MN/OR/WI are no more battlegrounds than red states like NC/MO, so that NYT's map is too bearish on Obama.
The main bone I have to pick with NYT is that they're so fixated on the 2004 results as a predictor of 2000. Once it becomes clear that IA is not much of a battleground state, I don't understand how they'll represent that it's clearly switched to Democratic. And similarly if it becomes clear that McCain will win NH. My guess is that they'll keep both states as "battlegrounds" even if they're obvious switches.
Cook Report
Charlie Cook either A) has been slow to react to the bounce Obama's received since Clinton dropped out and the Wright controversy fizzled, or B) believes that states will (with a few western and Floridian exceptions) mean-revert to their 2004 results. Those are the only reasons I can think of for him to be generally reasonable but somewhat too bearish on Obama.
Intrade
If you don't already know, Intrade is an Irish website where people can bet on elections. (They pay 0% on their large margin requirement, they charge significant transaction costs, and there's a significant spread in most markets, which are generally illiquid. The world deserves a better election betting site.) Despite their problems, they have some interesting results. In particular, as I've noted above, they are more bullish on Obama than anyone else but me. I think, though, that many predictions there are too close to 50/50, indicating that people believe there's significant volatility. I don't think the odds are close enough to 0/100 in several of the second-tier swing states, such as AR or MN. Best bets: Go long Obama in CO, NV, MN, and short in AR.
Intrade has the closest correlation to the average of any site, and the lowest sum of absolute differences with the average. I take this to mean that InTrade encapsulates common opinion very efficiently. On the other hand it means that it's a decent opportunity to make money if you know more than conventional wisdom.
US Election Atlas
Like Intrade, highly correlated with the average, which indicates that it follows conventional wisdom, at least in how people ordinally rank the states. The average result is very bearish Obama (259 electoral votes), probably for two reasons: 1) The site equally weights predictions that people make at different points in time. 2) When you make a prediction at the site, the default is to start with the 2004 results, which makes people unconsciously more 2004-centric than they might otherwise be.
posted by Benjamin Schak at 1:26 PM
![]()

0 Comments:
Post a Comment
<< Home