McCain by 1.9%
Commentary
The total "Wright effect" seems to have been a change of about 3.5% nationally, meaning that change in the the difference between support the two candidates has is a total of 3.5%. Unfortunately, there has been very little polling in the past week to gauge whether Obama is bouncing back. (Evidently, pollsters are more enthusiastic about generating headlines about Obama collapsing from Wright than they are about measuring whether the "Wright effect" is temporary.) Practically the only pollster to do anything this week was Rasmussen. Say what you will about Rasmussen, but at least they get off their asses and field some polls week in week out.
Despite the relative lack of recent polling, my best view of the situation is that Obama has stanched the bleed from the Wright issue but has not rebounded. McCain has now captured almost everyone whose opinion could be swayed by Wright's comments, and the race has settled into a new steady-state in which McCain is slightly ahead. Overall, that's probably good news for Obama (since it could be much worse), but certainly not great news. Obama is now doing worse against McCain than he has since February 2007, which was before many people knew anything about Obama and before McCain got himself into trouble with anti-immigrant Republicans by proposing McCain-Kennedy.
Digging into the numbers a little more, I see some evidence that McCain has gained about 2.25% while Obama has lost about 1.25%. Since about 10% of voters were undecided, that means that Wright's comments moved a net 10% of outstanding undecideds voters to McCain. I think it would be better for Obama if McCain had taken 1.75% and Obama had lost 1.75%. In that situation, Obama would just need to win back his former supporters in order to return to the status quo; in this situation, Obama will need to win back voters who never supported him to start with but who now identify with McCain.
One more thing: A 3.5% swing (+2.25% for one candidate and -1.25% for the other) may not seem like much, but it is. I remember that during the 2004 election, members of the media used individual polls that happened to change by large amounts in order to argue that the two conventions and the media's publicizing of the swift-boat ad each moved the polls by up to 10-15%. This was baloney, and to this day it skews people's perceptions of what a big change is. 3% is a big change for candidates' actual levels of support, but a small change when comparing two individual polls, because of sample error. The reality was that those events each moved the actual difference between Bush and Kerry support by about 1-2%. In the sort of 45-45-10 environment we're in, with balanced parties and few undecideds (the best historical example being the Gilded Age), a 1-2% swing can make a huge difference. For example, without the 2% swift-boat swing towards Bush, Kerry would have won IA and NM, and possibly OH, NV, the electoral college, and the popular vote too. For historical perspective, since the Republican Party was invented, a 3% across-the-board swing would have changed the electoral college results one-fourth of the time.
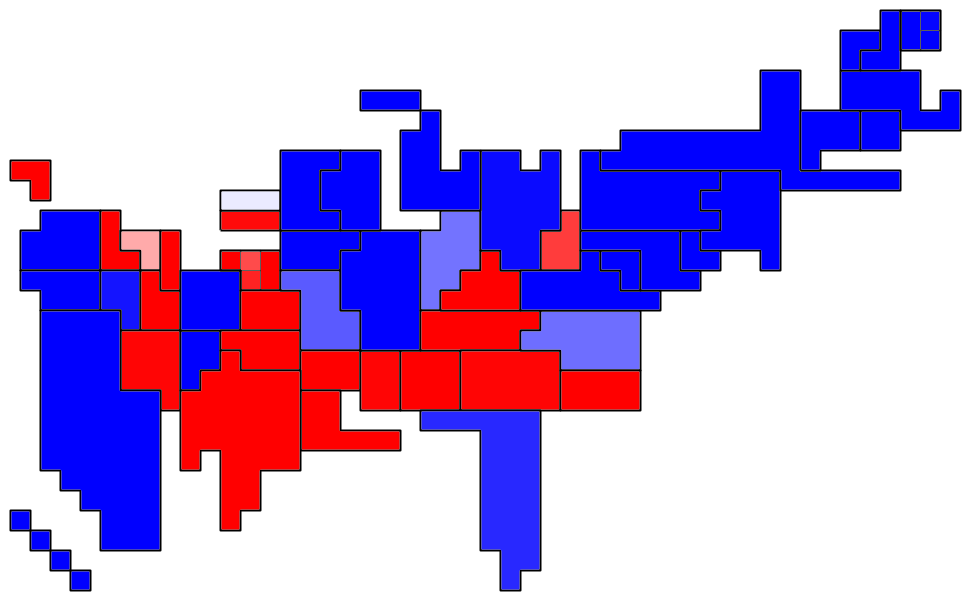
Popular vote estimate:
(Darker red means more votes for McCain, darker green for Obama.)
Prediction if the election were today
- Probability of electoral victory: 2%.
- Expected value of electoral votes: 242.
- 95% range of electoral votes: 207 to 257.
- Probability of electoral college tie: under 0.1%.
- Probability of popular victory: 3%.
- Expected popular vote: Loss by 1.9%.
- Swing states:
- PA 83%.
- OH 57%.
- Electoral vote distribution (electoral votes vs. probability):

- Confidence map (states sized by electoral vote, darker red means higher confidence that McCain will win, darker green for Obama):

Prediction for Election Day
- Probability of electoral victory: 26%.
- Expected value of electoral votes: 242.
- 95% range of electoral votes: 160 to 336.
- Probability of electoral college tie: under 1%.
- Probability of popular victory: 30%.
- Expected popular vote: Loss by 1.9%.
- Swing states:
- PA 91%.
- OH 84%.
- NH 65%.
- MO 58%.
- NJ 54%.
- MI 41%.
- FL 41%.
- WI 39%.
- NV 37%.
- CO 36%.
- NM 36%.
- Electoral vote distribution (electoral votes vs. probability):

- Confidence map (states sized by electoral vote, darker red means higher confidence that McCain will win, darker green for Obama):

Read more (maybe)!
posted by Benjamin Schak at 2:13 PM
0 comments
![]()


