Victory probability mapObama lead over time

Saturday, August 23, 2008

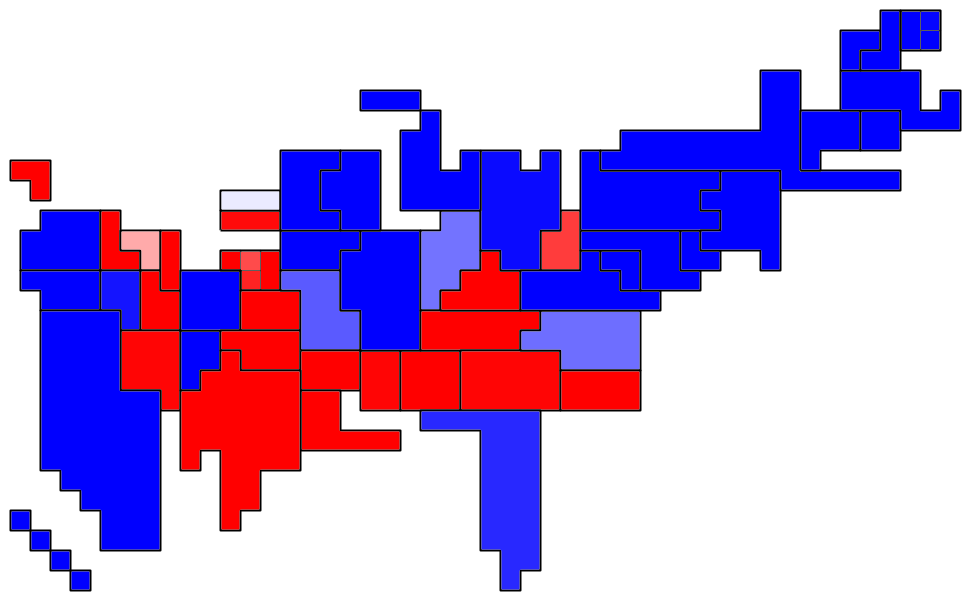
Political shifts since 2004 by state

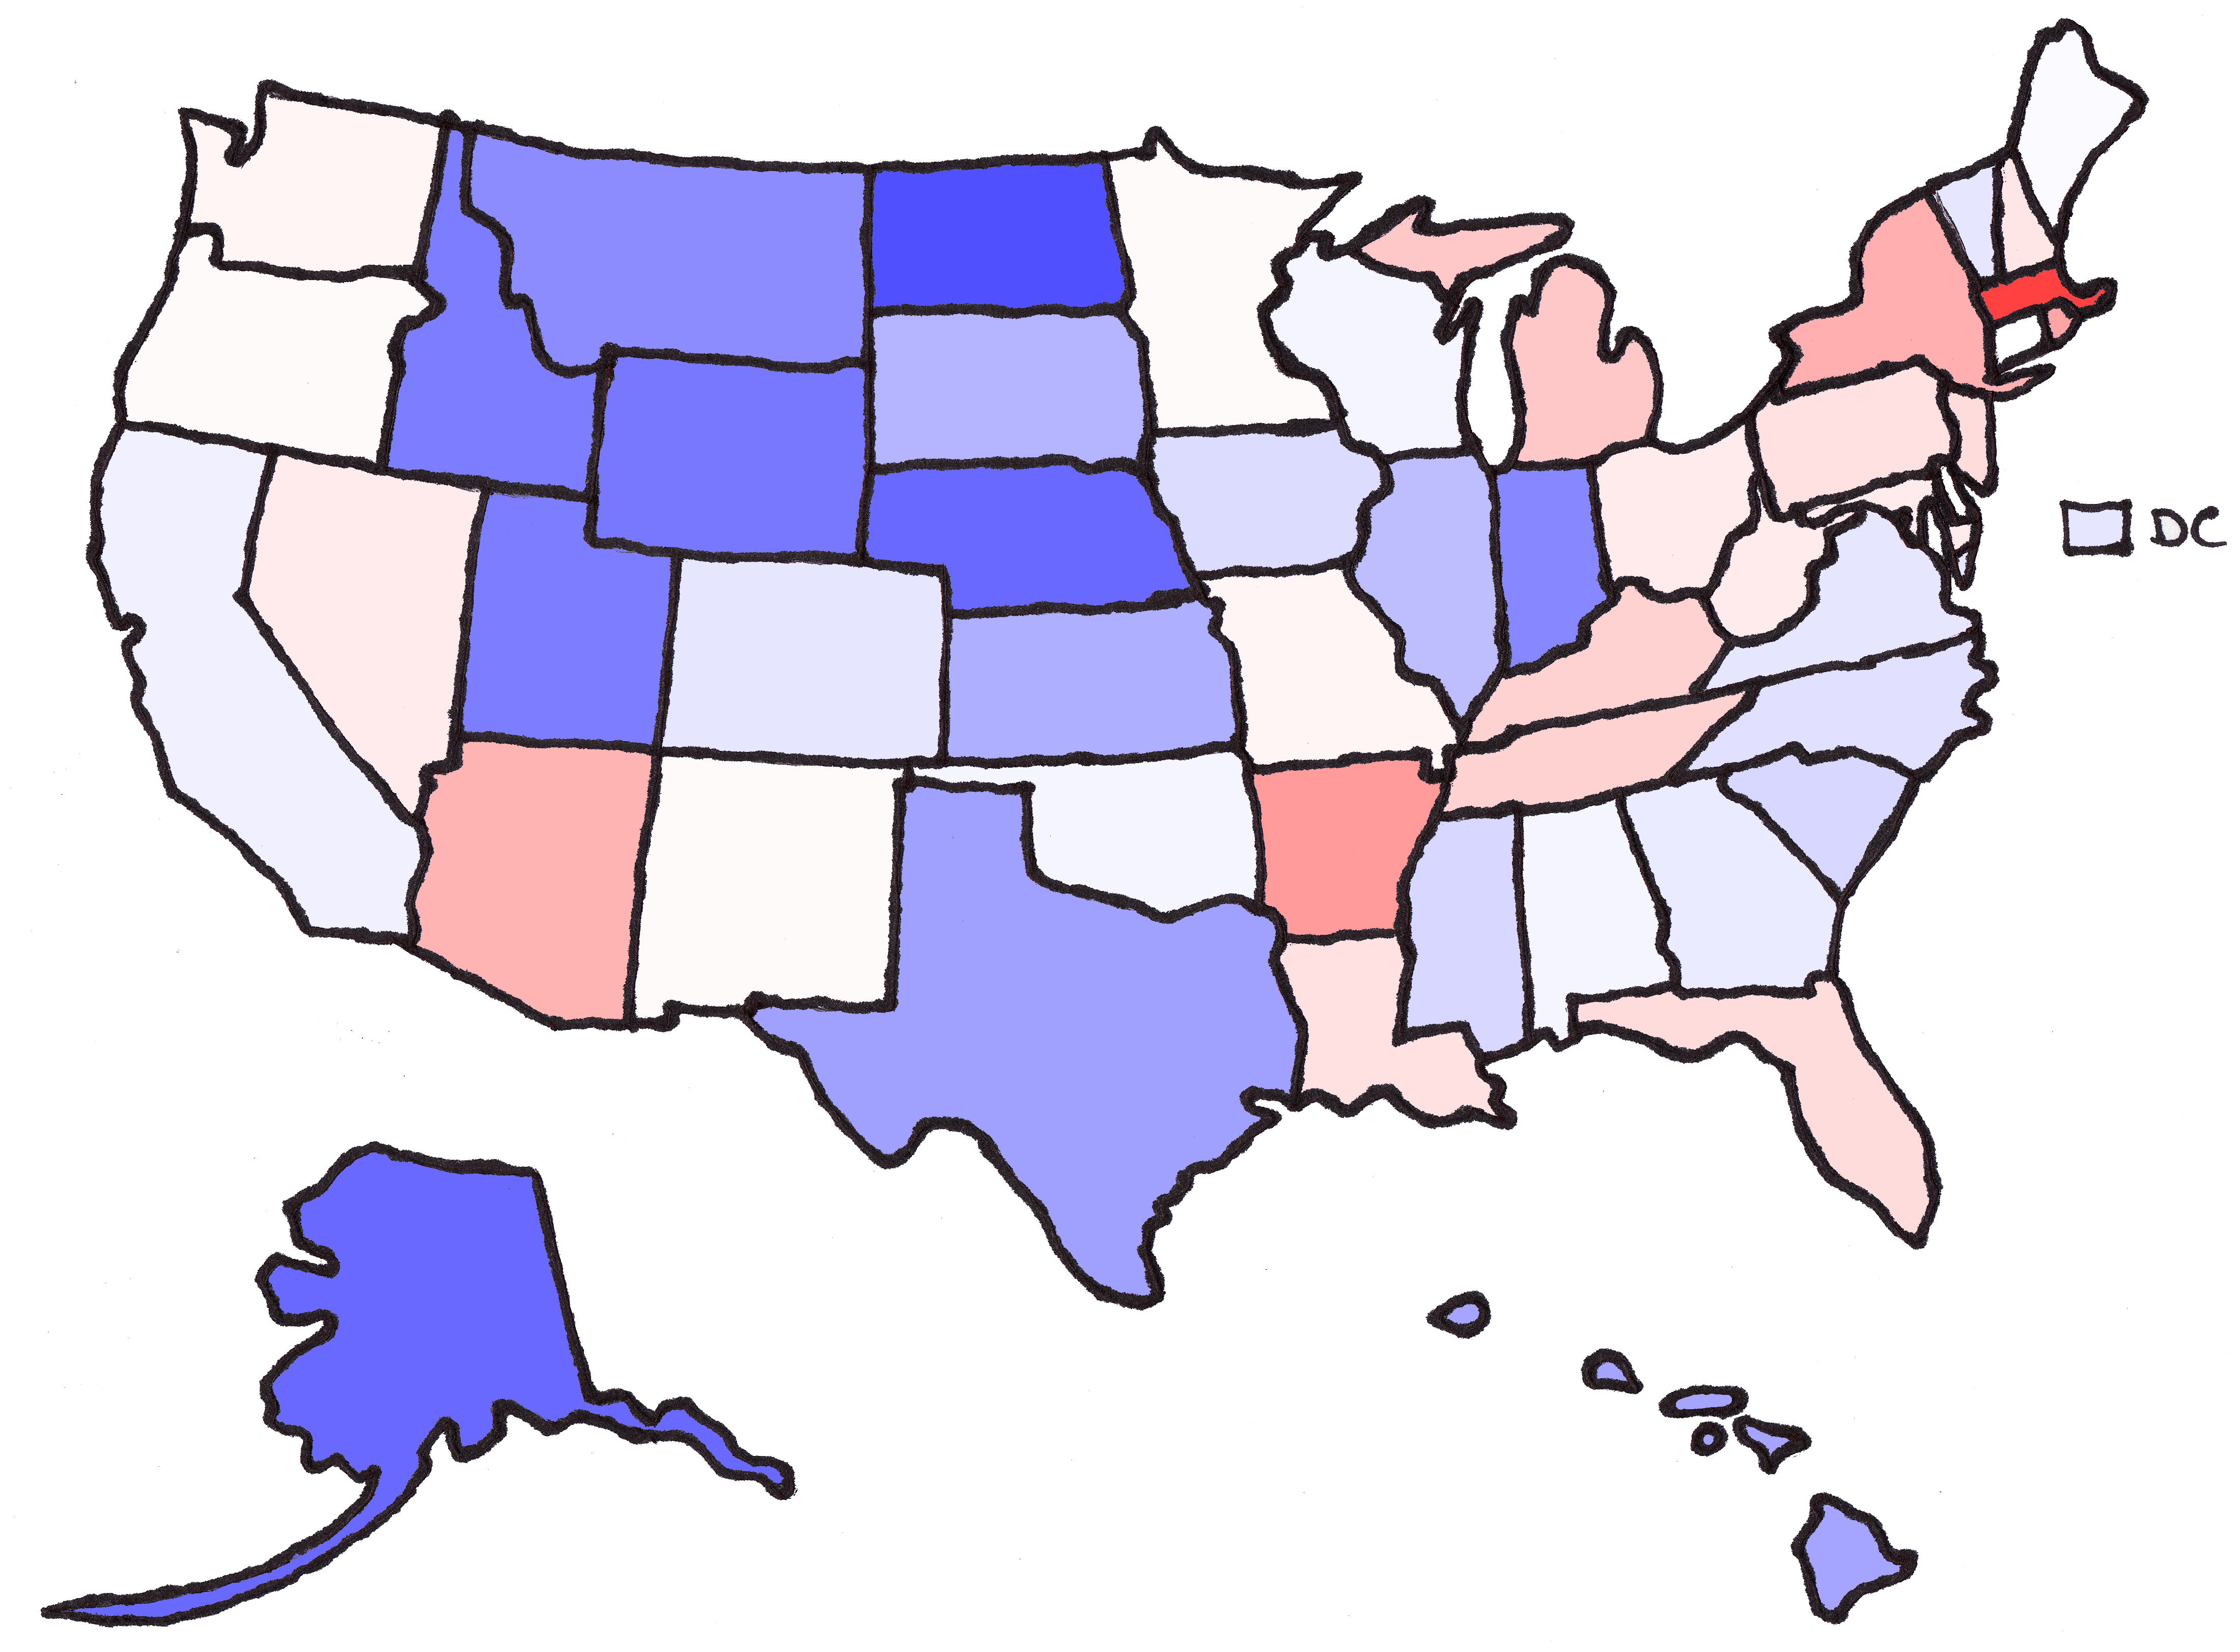
This map shows the change in each state from 2004 to present, relative to the national change. That means that, for example, OH is slightly red even though Obama is doing better there there Kerry did, since Obama has improved even more nationally than in OH. This map corresponds to the "trend" maps at Dave Leip's Atlas.

Change by state relative to national shift

The states with big shifts fall into some obvious groups, some of which may overlap:

Home States
MA was Kerry's home state, so Obama does much worse there than Kerry did; similarly, TX was Bush's home state, so McCain does much worse there than Bush did. In the reverse direction, Obama and McCain do better in their home states of IL/HI and AZ than Kerry and Bush did. Just to highlight the irrelevance of vice presidential nominees, a VP-less Obama is actually improving on Kerry/Edwards in NC.
Clinton States
Obama is doing way worse in AR and NY than nationally, states where there are probably concentrations of disappointed Clinton supporters. Aside from Clinton's home states, I notice that, by and large, Obama seems to be doing poorly in states where Clinton did well in the primary. There are two explanations: People there were Clinton supporters who are now bitter over her loss, and have therefore turned away from Obama. Or, people there didn't like Obama during the primaries and still don't like him. I tend to favor the second explanation.
Cheaters
FL and MI scheduled their primaries earlier than the rules allowed, and then got their convention votes fully stripped by the Democrats (and partially stripped by Republicans).
Rust Belt
MI, OH, and PA. In addition to adding foreign policy expertise to the ticket, I think that the pick of Biden is intended to help Obama among white working-class Democrats and independents in these important states. OH is surprising to me, given the collapse of the Republican brand in that state.
Mountain West
Obama's overperformance in the West has been stunning. Part of it may be that Kerry was unappealing to Western voters, so that Obama's strength is just the consummation of a Democratic improvement in the West that started several years ago. This includes AK, where Republicans are having a terrible year. McCain has surprisingly failed to use his experience in land and water issues to any advantage, recently suggesting a renegotiation of Colorado River rights. Oddly enough, the convention state of CO has been among Obama's weakest in the West, but that may change after the convention.
Black Belt
The states from AL to NC with large Black populations that may be energized by Obama's candidacy.
Indiana
I can't explain why Obama would improve so much in IN, when he's trending down in MI, OH, and KY. His improvement in IN is even greater than IL.

By the way, if anyone else needs a non-detailed outline map of the US that's easy to bucket-fill, it's here.

It's not perfect, and I regret the decision to turn the Aleutian Islands into a peninsula, but it's serviceable.

Read more (maybe)!

Obama up by 1.2%; 62% chance of victory

Prediction for Election Day

  • Probability of victory: 60% electoral, 62% popular. This includes a 2% chance of tie.
  • Expected value of vote: 280 electoral votes, popular win by 1.2%.
  • 95% range of electoral votes: 182 to 384.
  • Must-win states (pseudo-Banzhaf):
    • MI .060
    • CO .051
    • OH .050
    • NM .029
    • PA .026
    • NV .021
    • VA .019
  • Bellwether states (correlation):
    • 70%+ CO, MI, OH
    • 60%+ NM, NH
    • 50%+ PA, VA
    • 40%+ WI
    • 30%+ MO, FL
  • Confidence map (states sized by electoral vote, darker red means higher confidence that McCain will win, darker blue for Obama): Map showing my confidence in who the leader will be.

Prediction if the election were today

  • Probability of victory: 75% electoral, 82% popular.
  • Expected value of vote: 280 electoral votes, popular win by 1.2%.
  • 95% range of electoral votes: 242 to 311.
  • Must-win states (pseudo-Banzhaf):
    • MI .121
    • CO .117
    • OH .082
    • NM .063
    • NV .042
    • VA .029
    • PA .028
  • Bellwether states (correlation):
    • 50%+ CO, MI
    • 40%+ OH
    • 30%+ NM, NV
  • Confidence map (states sized by electoral vote, darker red means higher confidence that McCain will win, darker blue for Obama): Map showing my confidence in who the leader is.

Popular vote estimate

(Darker red means more votes for McCain, darker blue for Obama.) Map showing my estimate of the popular vote on 08-22-08

Read more (maybe)!

Thursday, August 21, 2008

Obama drop

Obama has continued to drop in the polls, and I now have McCain favored in OH, NV, and VA. The good news for him is that he's still winning the popular vote, winning the electoral vote, and (unlike Kerry) he doesn't need OH to win: Obama's minimal coalition is Kerry+IA+NM+CO.

I've updated the time-series chart, and I'll update the sidebar and graphics this weekend. In the meantime, I'm cheering for the Americans to make a big comeback in the volleyball finals...


Read more (maybe)!

Monday, August 18, 2008

VP timing

Jerome Armstrong at MyDD reports that McCain will announce his VP pick on Friday, 8/29, one day after the Democratic convention ends. Friday is traditionally the day to make announcements that you don't want the press to cover, but it's hard to see what earlier date would be better. If he announces between now and 8/24, he'll be fighting the Olympic coverage. If he announces between now and 8/27, the Democrats would have 1-4 days of convention coverage to define his pick. If he announces during the Democratic convention, 8/25 to 8/28, he looks gauche and possibly gets negative process stories from the Washington press. And if he announces on 8/28, he'd be going head-to-head against an Obama speech, which he'd do well to avoid. I think if I were McCain, I'd announce the VP on the day that Bush speaks at the Republican convention, in order to swamp coverage of Bush.

I do remember noticing in 2004 that Kerry got a larger convention bounce in PA than nationally, possibly because he had a huge, well-publicized rally in Philadelphia just before the convention that had a multiplier effect. McCain is hoping for an outsize gain in OH, and he think he'll get it.


Read more (maybe)!

Sunday, August 17, 2008

Tie scenarios

It's been a slow week here, as I've been spending all my free time watching the Olympics. (Definitely not watching the candidates discuss faith with Rev. Warren.) In my absence, it looks like Obama has resumed a modest post-June slide that has been broken only by his international trip. Absent major scandal, I'd be surprised if there were significant movement before the conventions.

For that matter, I expect the bounces for both parties to be very small, as they were in 2004. With so few undecided voters out there, a few hours of coverage by a few channels isn't going to make a big difference. But I could be wrong, particularly if Obama announces a VP at the convention.

I checked 538.com today, and saw that had an interesting post today about electoral tie scenarios. My simulations indicate a somewhat higher probability of a tie than theirs do (1.2% as opposed to 0.7%). I think this is a result of my belief that public opinion is less volatile than 538's methodology would imply. (Other examples of this phenomenon: They give McCain a 6.4% chance of getting 375+ votes, while I give him a 0.4% chance. Their most likely result has probability 2.2%, while my most likely result has probability 4.7%.)

Furthermore, my simulations give fewer possible scenarios for electoral ties. I just ran 50 simulations of electoral ties, and found that they broke down as follows:

  • Gore+NV+NH = Kerry+IA+NV+NM. 29 out of 50 simulations. Obama won the popular vote in 25 of these. I haven't studied the simulations closely yet, but this seems very plausible if McCain strengthens just enough nationally to make the western CO/NV/NM very close.
  • Gore+CO = Kerry+CO+IA+NM-NH. 18 out of 50 simulations. Obama won the popular vote in 8 of these. This combination seems to happen when the race remains stable out West, while McCain pulls ahead among the NHers who have always loved him in primaries.
  • Gore+CO+NH+VA-MI = Kerry+CO+IA+NM+VA-MI. 3 out of 50 simulations. Obama won the popular vote in all of these. Obama has improved over Kerry in almost the whole country, but not in MI. If there's an important D-leaning state that McCain can pick off, it looks like it might be MI, which is why it's my #1 swing state.
  • Other. 0 out of 50 simulations. 538.com does come up with other combinations, like Gore+NH+WV, but I find these implausible, at least unless Robert Byrd is the VP pick. If Obama somehow wins Applachian voters in WV, he will surely also win them in the much harder-fought states of OH and VA.

Read more (maybe)!

Sunday, August 10, 2008

Wasted gains

I've heard some pundits notice that a significant component of Obama's gains have been in irrelevant strongly red states. To some extent, I believe this is correct. To measure whether this is correct, I calculated the correlation (weighted by electoral vote) between 1) Obama's improvement by state, measure as (2008Obama-2008McCain)-(2004Kerry-2004Bush), and 2) the 2004 typicality of states, measured as (2004Kerry-2004Bush)-(2004KerryNatl-2004BushNatl). The result is a 25% correlation, which is medium-low, but enough to indicate that Obama tends to waste more votes than Kerry did.

This doesn't mean that McCain has an electoral college advantage yet though. Remember that Kerry had a significant electoral college in 2004, losing nationally by 2.5%, but electorally by only 2.1% in OH. By adding some wasted votes, Obama has made the electoral college almost perfectly neutral this year. That is to say, I estimate that if the popular vote moves to 50-50, both candidates have an equal probability of electoral victory. Obama is also helped a little bit because Democrats have captured a solid majority of state delegations in the House, meaning that a tie now goes to the Democratic nominee.

This is really a second-order thing, though. The Big Deal is that Obama has improved across the board by 5%. He hasn't posted 15-20% gains in swing states the way he has in deeply red western states, but he has gains 9% in IA and 7% in WI to put those former swing states out of reach, 8% in CO to turn that into a legitimate swing state, and major gains in VA, MT, and IN to put those states in play. Not to mention, he's had modest but significant 2-5% gains in swing states NH, PA, OH, FL, MO, NM, and NV. (Alone of swing states, MI has been flat.) Meanwhile, the race has improved for Republicans only in five states: 2% in AZ (McCain's home state), 2% in NY, 2% in RI, 4% in AR (the only former swing state where McCain has gained), and 13% in MA (Kerry's home state).


Read more (maybe)!

Dear John Quinn of Parma, OH

Dear John Quinn of Parma, OH, STFU.

When I was at a so-called "town hall meeting" for John McCain in April, he didn't start it with the Pledge of Allegiance; rather, his MC started it by inviting Chris Shays up to the stage for impromptu remarks. Nor did McCain lead the pledge when his turn came to speak. In fact, the event didn't include the Pledge at all, despite four US flags being displayed on the small stage.

Labels: , , ,


Read more (maybe)!

Olympic advertisement

A couple weeks ago, the two campaigns made news with $5-6MM ad buys for the Olympic TV coverage. My take is that both campaigns ads are fairly good, but that Obama's positive ad has a better tone for an Olympic broadcast than McCain's mixed negative-positive ad. (More below the fold.)

Edited to add: When an observation is this obvious, everyone notices. See here on Kos by BarbinMD, here again on Kos by BarbinMD, and here on 538.

As some news analysis about ads from the AP says, Olympic advertisement tends to have themes of "unity," "the spirit of athleticism," "humanity," and (moreso in other years than this one) "national pride." When companies pay top dollar to release ads during the Olympics, they don't tend to be ordinary "3 out of 4 people prefer the taste of Pepsi" ads---they tend to be "Coca-Cola teaches the world to sing" ads.

Obama's "Hands" ad is a good commercial per se, but I think the aspirational can-do theme of potential achievement makes it a great ad for the Olympics.

By contrast, McCain's "Family" ad would be a decent ad for a cable news show where guests are shouting over each other to insult candidates, but the negativity of the Ominous Woman narrator clashes badly with the overwhelming positivity of everything around it during the Olympic broadcast. It's also confusing for the commercial to begin by implying that it's bad for crowds to be cheering for Obama, moments after the network cuts away from crowds cheering for athletes. Also, I think it's a bad choice to use the same narrator for both the negative and positive halves of a political commercial; every detail of a contrast ad (lighting, background sound, narration, etc.) should enhance the desired contrast.

I'm not creative enough to come up with a good idea for McCain's campaign, but I would think that he could effectively use a theme of American pride or victorious emergence from personal struggles.

I've been watching the Olympics so far on cable channels from a SW Connecticut provider, and broadcast channels from New York and New Britain (CT, between New Haven and Hartford). I've seen a ton of the McCain ad, and the Obama ad only once. I don't think it makes much sense for either candidate to be advertising in a NY/CT/NJ market, so I'm glad I'm seeing more McCain ads here. Any other reports of Olympic ads broadcasting in unexpected places?


Read more (maybe)!

Sunday, August 03, 2008

Wisdom about interpreting polls

This DailyKos post by "DemFromCT" has a lot of wisdom about reading polls. Some of the points there (Look at all the polls, Polls are a snapshot in time) are fundamental to the work I'm trying to do here. I think my only small quibble is that I believe that a snapshot in time today can be boundedly predictive of future results, since public opinion has a measurable amount of volatility.

The statement that state polling is more difficult than national polling is surprising to me, and I'm curious why DemFromCT thinks that, or what the evidence is. Anecdotally, from things I've been involved in, I can remember both the Star Tribune's poll on the 1998 MN gubernatorial race and Terry Madonna's poll on the 2006 PA-08 congressional race being way off the mark (speaking of Terry Madonna, who died and made him Grand Guru of Pennsylvania Politics?), but the dual of "anecdote" is not "data." I actually would have guessed that a national poll or a poll in a large heterogeneous state would be more difficult than a poll in a small homogeneous state. In a place like CA, a pollster has to account for different populations of people having different access to phones, speaking different languages, having different propensities to answer surveys, etc.; while in a place like ND, there's basically just one undifferentiated population.

One thing that DemFromCT emphasizes, but that I've never paid much attention to, is the difference between LV and RV (and, god forbid, A) polls. Now that I've worked through parameter-setting, something I might try to figure out is how to measure the uncertainty implied by the difference between LV and RV results. For now, my methodology is simplistic: If a pollster only gives one result, I use it; if a pollster gives both LV and RV results, I use RV for polls before the conventions end, and LV for polls after the conventions end.


Read more (maybe)!