I'm not bending over backwards to pull mathematical punches here, although there shouldn't be anything beyond an intro stat course. For clarification, post a comment. Although I'm a math student, I've never studied any statistics, so if you have suggestions (and I have a couple places where I could use them), post a comment.
The first step is to assemble statistics on each state. When a poll has numbers available both with and without Nader, I only use the numbers with Nader if Nader is on the ballot in the state in question when I record the poll data in my spreadsheet. I'll use Missouri as an example, with currently available polling data and the present date of May 31st. There have been two polls in Missouri, a March 23rd (69 days ago) Rasmussen poll and a May 23rd (8 days ago) poll. (For the dates, I use the ending dates of the polls.) The Rasmussen poll counted 245 for Bush and 210 for Kerry; the Zogby poll counted roughly 255.273121 for Kerry and 237.425635 for Bush. (Most pollsters don't publish exact counts, so I make a numerical estimate from the published percentages and sample size; Zogby doesn't publish sample sizes, so I estimate sample size based on margin of error.)
Polls get stale as time passes, so I weight all the polls. The weight is 1 for a poll that ended today, 1/2 for a poll that ended four weeks ago, 1/4 for a poll that ended eight weeks ago, and so on. The Rasmussen poll is 69 days old, so it has a weight of (1/2)^(69/28) = 0.185749, and the Zogby poll is 8 days old, so it has a weight of (1/2)^(8/28) = when 0.820335. Hence, the weighted Rasmussen counts are 39.00735 for Kerry and 45.50858 for Bush, and the weight Zogby counts are 209.4096 for Kerry and 194.7686 for Bush. The one-month half-life for polling data is ad hoc, and I'm interested in figuring a more principled decay function.
Adding these weighted counts, we get that Kerry has 248.4169 total weighted "votes" and Bush has 240.2772. Then the Kerry mean is 248.4169/(248.4169+240.2772) = 0.508328 of the vote, and the standard deviation is the square root of 0.508328*(1-0.508328)/(248.4169+240.2772), which is 0.022615. Since Kerry's mean is 0.008328/0.022615 = .3682512 standard deviations above 0.5, a lookup in a standard normal distribution table shows that Kerry has a 64.3659% chance of winning Missouri's 11 electoral votes.
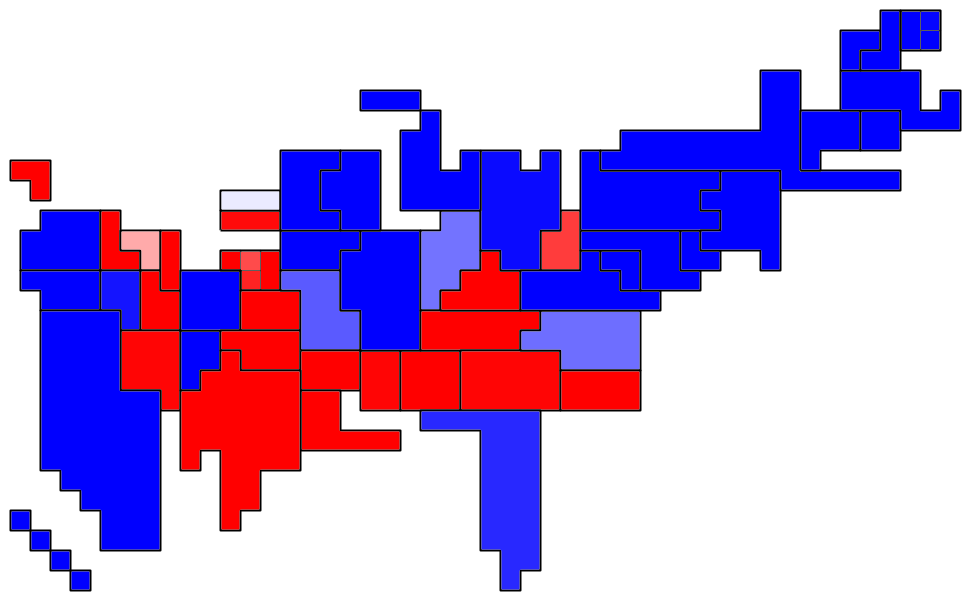
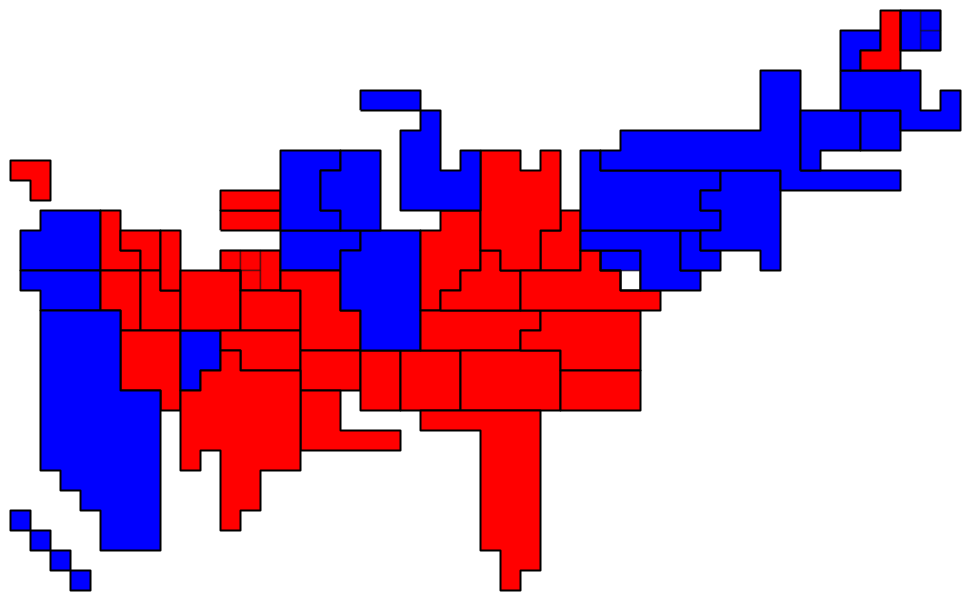
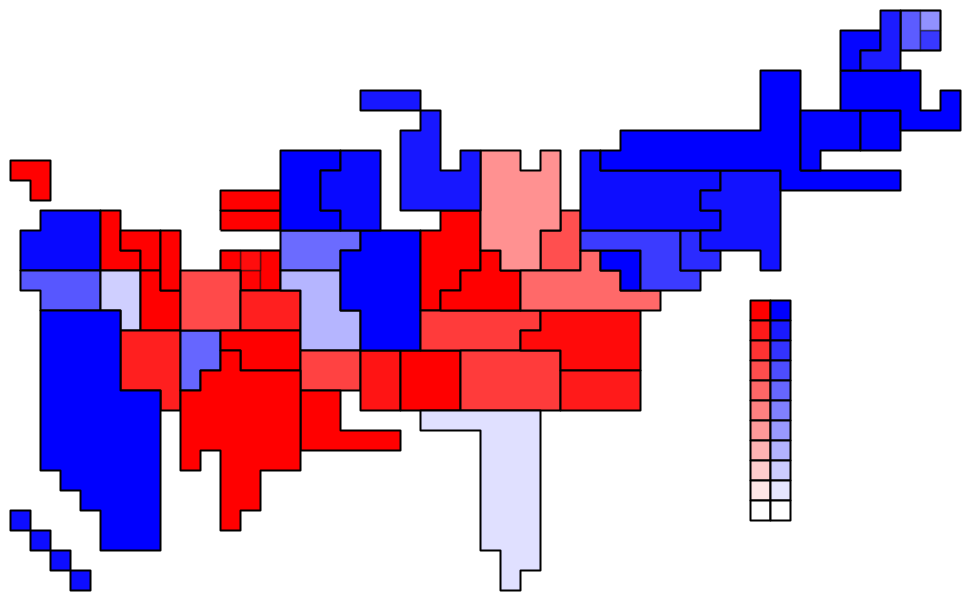
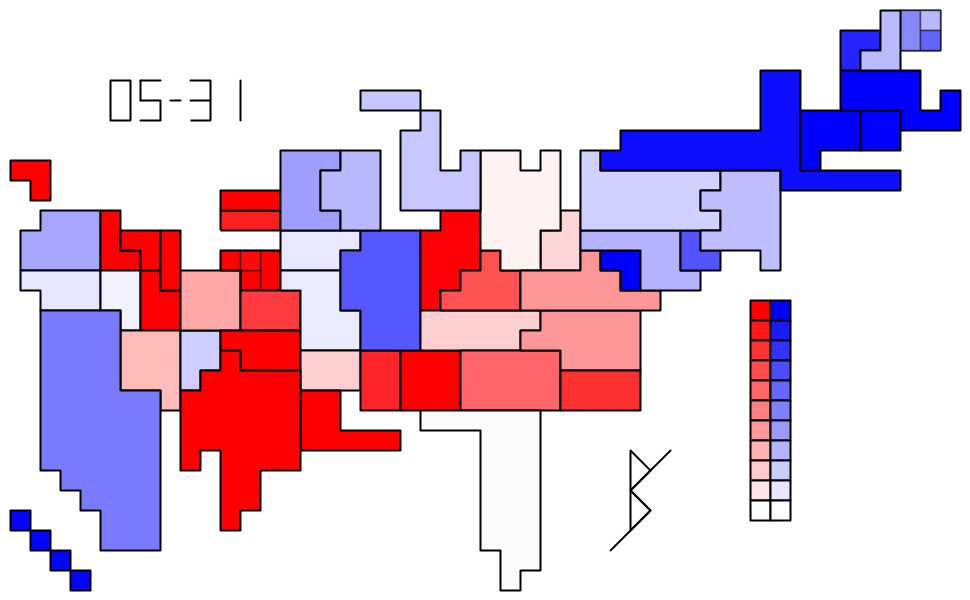
This is already enough information to make my "Confidence" map (Kerry's 64.3659% chance of winning translates into a 29% saturation shade of blue since (64.2659-50)*2 is about 29) and my "Percentages" map (50.8328% of the Kerry/Bush vote translates into an 8% saturation shade of blue).
Now for the national statistics. The expected number of Kerry electoral votes is easy to compute: I just take the sum (number of electoral votes)*(chances of Kerry winning) over all the states (more precisely, the sum over all the electoral-vote-granting regions, including DC and the congressional districts of Maine and Nebraska).
The probability of Kerry winning is more complicated: It entails the calculation of the probability of Kerry getting precisely n electoral votes for every n from 0 to 538. For each state I form a polynomial as follows: For Missouri in the example above, I write (1-0.643659*(1-x11)), since Missouri's 11 votes have a .643659 chance of going to Kerry. Then I multiply all the states' (electoral-vote-granting regions') polynomials together into a generating polynomial in which the xn coefficient is the probability that Kerry will get precisely n votes. Therefore, the probability that Kerry will win is just the sum of the x270 through x538 coefficients.
With these coefficients it's easy to calculate the median number of Kerry electors, although this is only interesting if I'm planning to offer a spread on the election.
There are a few details I haven't covered. 1) my method for states that lack significant polling data; 2) my method for calling the Congressional district votes of Maine and Nebraska; 3) my method for predicting the popular vote.
First, states with insignificant or no polling data. Consider Rhode Island, which hasn't been polled since February and currently has 15.07188 weighted "votes" for Kerry and 8.815625 for Bush. This gives a total of 23.8875 weighted votes and a massive standard deviation of around 10%, so I pad the data with 2000 election returns. Gore got 0.656491 of the Rhode Island vote in 2000, so I give 0.656491*(100-23.8875) extra weighted votes to Kerry and (1-0.656491)*(100-23.8875) extra to Bush. This gives a total of 65.03906 Kerry votes and 34.96094 Bush votes, and I recalculate Rhode Island's odds on this basis. For a state with no polls at all, this method essentially uses a 100-vote sample with proportions based on 2000. The number 100 is ad hoc, and I'm interested in finding a more principled number.
I have no polling data on Maine's and Nebraska's individual Congressional districts. Since I don't have polling data at all for Nebraska from the 2004 cycle, I calculate Nebraska's Congressional districts based on their 2000 returns as if they were a poll-less state. Consider Maine's 1st district which voted 176293-148618 for Gore in 2000. Maine overall voted 319951-286616 for Gore, and now has an expected popular vote of 331088.1 to 275478.9, since Kerry has 0.545839 of the weighted "votes," 331088.1 = 0.545839*(319951+286616), and 275478.9 = (1-0.545839)*(319951+286616). This means that 11137.1 votes statewide have shifted to Kerry, of which 5965.7 = 11137.1*(176293+148618)/(319951+286616) are in the 1st district. Thus, I use 182258.7 = 176293+5965.7 votes for Kerry and 170327.3 = 148618-5965.7 votes for Bush, scale that down to 100 total votes so that Kerry has 51.69197 and Bush 48.30803, and make my predictions. Same for the 2nd district. This method ensures that my expected popular votes for the congressional districts fit with my expected popular votes for the whole state.
I estimate each state's popular vote by multiplying that state's total Bush/Gore vote from 2000 (no Nader, Buchanan, or other votes) by Kerry's expected percentage in that state. Then I add all the states' popular votes to get the national popular vote. I care about the Electoral College and I don't care about the popular vote, so I make no attempt to adjust for population shifts, to count 2000 Nader votes, to factor in current undecideds, or (in short) to be the least bit accurate.
The main advantage of my methodology is that by combining polls I am able to squeeze statistics out of a potpourri of conflicting, small-scale, and sometimes stale polls. By giving polls a half-life of one month, I recognize that old polls can convey significant information but can be superseded by new data.
Read more (maybe)!
